
Summary: A complete indicator must include a description of the indicator, a baseline with a date, a target with a date, a source, a frequency and who is responsible. Otherwise, it is not an indicator.
Not again! A client recently asked me to review their indicators. It nearly broke my heart to have to tell them: The set of indicators that they worked on over months are – in one word – worthless. What a waste of time and resources!
You ask why? It’s simple. An indicator is not just a description. For example, the statement Number of print media reports on Gender Based Violence per month is not yet a full indicator. To be complete and useful, an indicator has to include much more.
What an indicator must have
Let’s first take a look at an example of a complete, useful indicator:
“Number of print media reports on Gender Based Violence per month; baseline (05/2020): 2; target (12/2026): 12, source: quarterly media monitoring of 5 main newspapers; responsibility: M&E unit; frequency: quarterly
If we take a closer look, it turns out that that this indicator consists of at least six major elements:
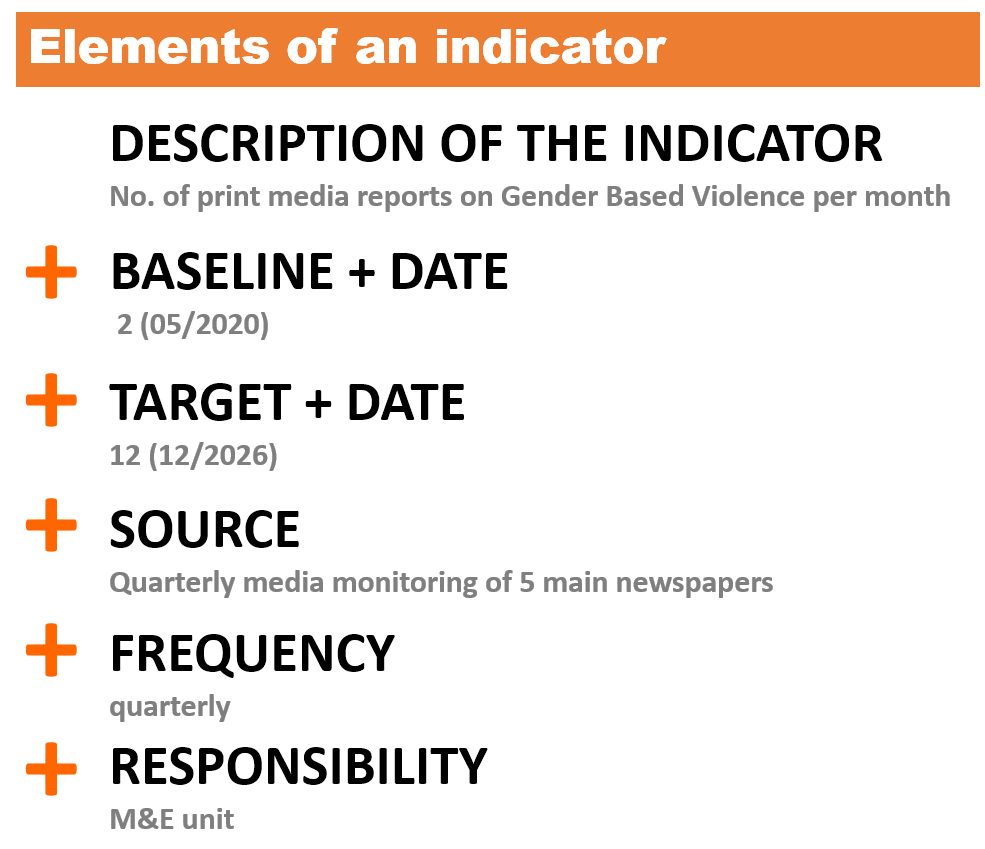
Different organisations have different ways of writing down indicators. Unfortunately, there is still no single standard. But ultimately, that doesn’t matter. Whatever format is used, any useful indicator must include at least these six elements. Let’s look at each of these elements in more detail:
1. Description of the indicator
This is the easy part, and even worthless indicators include this element. It simply describes what we measure and track over time. In our example, this element is Number of print media reports on Gender Based Violence per month.
2. Baseline data (with date)
This is already where many indicators fail: They do not include baseline data. I have seen hundreds of M&E plans where the baseline data only indicates ‘TBE’ (=to be established). Or even worse: ‘N/A’ (not applicable). What does that even mean? We define an indicator, and already at the planning stage we admit that we’ll never be able to measure it?!?
So what are we talking about? The indicator baseline data is the status of the indicator at the beginning of a programme, a policy or a service. It tells us the starting point. In other words, the baseline acts as a reference point against which we can assess progress or achievements. The indicator baseline date simply tells us when the baseline data was collected. In our example, the baseline with the date is baseline (05/2020).
The general (and very simple) rule is: If we don’t have baseline data at the beginning of a programme, a policy or a service, we cannot use this indicator. And that’s it. Let’s look for something else. Or, if it is feasible: Let’s start collecting this data now, so we have a baseline before we even start. For options on data collection, check out our blog on primary. data collection.
3. Target data (with date)
The indicator target data is similar: It is the desired status of the indicator at a defined time in future. In our case, it is target (12/2026). Again, in many cases I have seen, this is simply left out. So how can we judge if outputs were delivered or outcomes achieved as planned? And yes, setting targets is sometimes complex and complicated, especially at the outcome level. But it must be done.
4. Data source
The source describes where the data for the indicator is coming from. We sometimes called ‘means of verification’ or in short ‘MoV’. In our case, the data source is source: quarterly media monitoring of 5 main newspapers. If data comes from existing (=secondary) sources, the source should be described in detail. For example, instead of ‘Annual Reports‘, write ‘Annual Budget Report of the Ministry of Finance‘, ideally with a web link to the reports. If it comes from data that we still need to collect (=primary data), describe that in as much detail as possible as well.
5. Responsibility
Responsibility refers to who is in charge of collecting the indicator data – if it is primary data – or who will retrieve the data in case of secondary data. In our example, we write this as responsibility: M&E unit.
6. Frequency of data collection
The frequency defines how often we update the status for the indicator over time. In our example, this is frequency: quarterly. In most cases, the frequency of data collection will be monthly, quarterly or annually.
Summary: A complete indicator must include a description of the indicator, a baseline with a date, a target with a date, a source, a frequency and who is responsible. Otherwise, it is not an indicator.
Checklist for stellar indicators
Use these six elements of an indicator as a checklist. When designing indicators, it helps you including all relevant elements of an indicator. If you are reviewing existing indicators, it allows you to critically assess them and propose improvements.
So remember: A complete indicator must include a description of the indicator, a baseline with a date, a target with a date, a source, a frequency and who is responsible. Otherwise, it is not an indicator.
Did you like this blog post? There is more! We are currently offering a free course on Practical Results Based Management. Enrol now.